Accurate ECG documentation is essential for both learning and clinical practice, and the ecg components lab notebook serves as a structured tool to record and analyze cardiac activity. It allows students and practitioners to track P waves, QRS complexes, T waves, intervals, and segments systematically, ensuring that every observation is clear, precise, and replicable. By organizing ECG data effectively, users can compare normal and abnormal patterns, making the lab notebook an indispensable part of physiology education and practical training.
Using an ecg components lab notebook also supports consistent measurement, annotation, and interpretation of heart signals. Whether in a classroom or clinical setting, it provides a reliable reference for understanding cardiac conduction, evaluating heart rhythms, and maintaining high standards of documentation. A well-maintained lab notebook not only enhances learning but also builds foundational skills necessary for professional practice in cardiology and related health sciences.
Understanding ECG: Basic Overview
What is an Electrocardiogram (ECG)?
An ECG is a test that records the heart’s electrical activity.
-
It captures the depolarization and repolarization of the heart muscle.
-
Each heartbeat produces a waveform that reflects cardiac conduction.
-
These waveforms help identify normal and abnormal heart rhythms.
Historical Development and Clinical Relevance
ECGs have been used clinically for over a century.
-
Early techniques involved string galvanometers and paper tracings.
-
Modern digital ECGs provide high-resolution signals for diagnosis.
-
ECGs are essential in cardiology, emergency medicine, and physiology education.
Core Components of an ECG
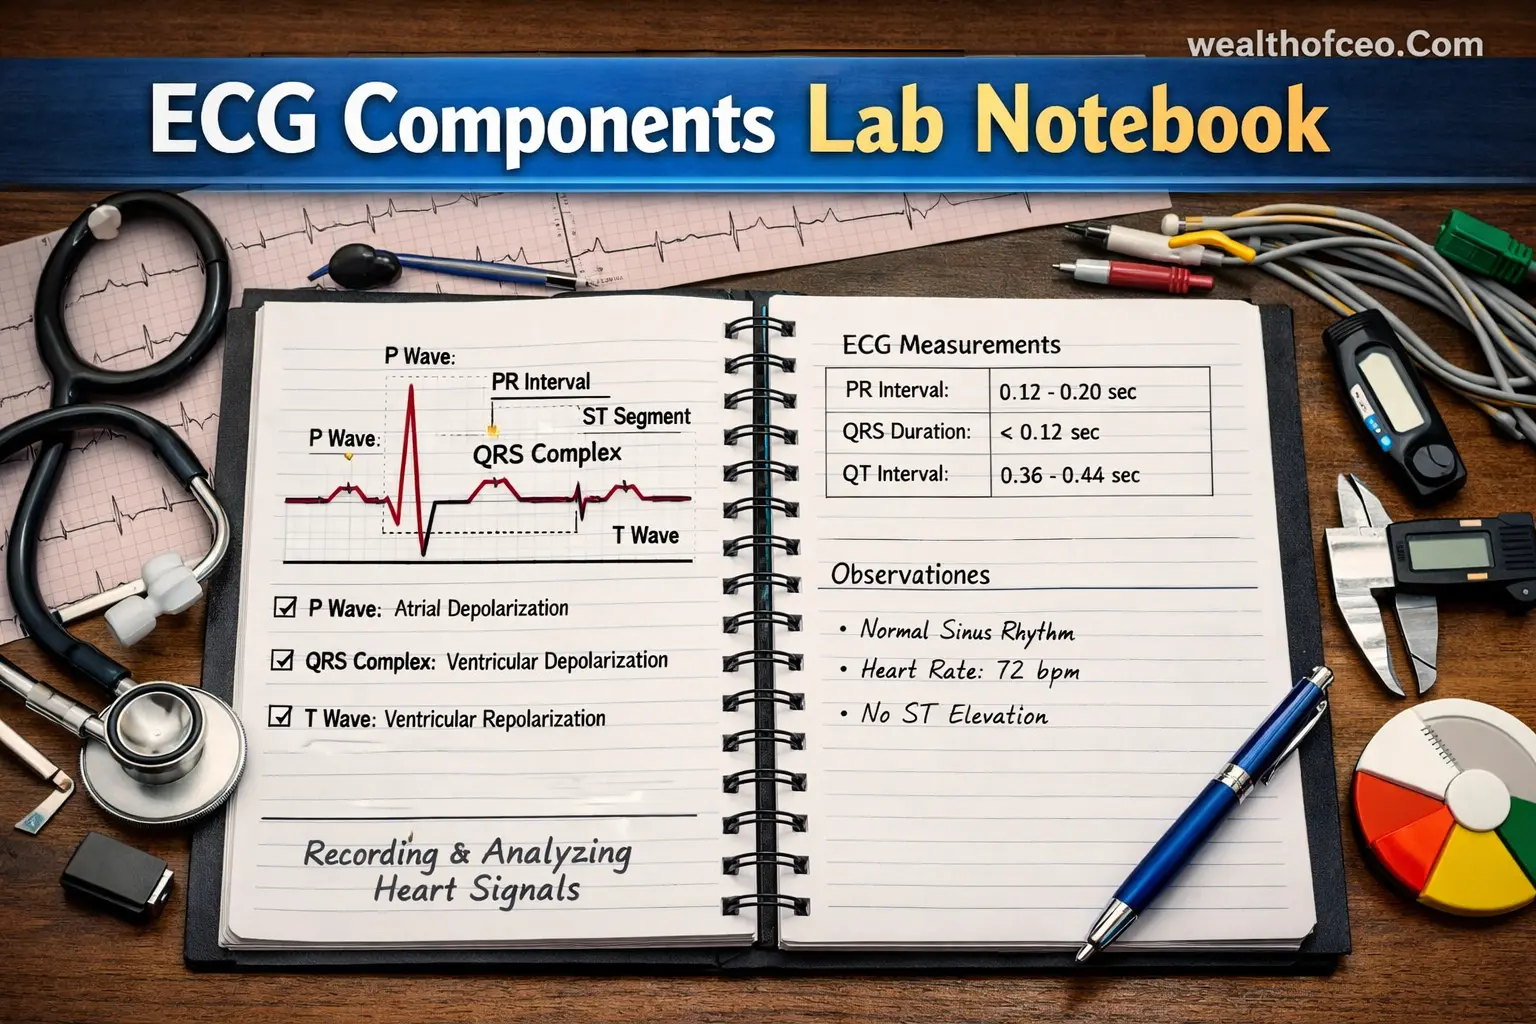
P Wave: Atrial Depolarization Explained
The P wave represents atrial depolarization.
-
Occurs as the atria contract to push blood into the ventricles.
-
Typically upright in most leads, small in amplitude, and short in duration.
-
Recording this wave helps assess atrial function and rhythm regularity.
QRS Complex: Ventricular Depolarization
The QRS complex shows ventricular depolarization.
-
It triggers ventricular contraction, producing the main heartbeat force.
-
Duration is brief, usually 0.06–0.12 seconds.
-
Its morphology can indicate conduction abnormalities or heart disease.
T Wave: Ventricular Repolarization
The T wave represents ventricular repolarization.
-
Ventricles return to their resting electrical state.
-
Usually upright and follows the QRS complex.
-
Changes in T-wave shape or amplitude may signal ischemia or electrolyte imbalance.
Other Key Elements: U Wave, PR Interval, ST Segment
-
U Wave: Small wave following T wave; may indicate late repolarization.
-
PR Interval: Time from the start of the P wave to the beginning of QRS; reflects AV node conduction.
-
ST Segment: Flat segment after QRS; deviations can indicate ischemia or infarction.
How an ECG Works
Electrical Conduction in the Heart
The heart generates electrical impulses that coordinate contraction.
-
SA node initiates depolarization, spreading through atria.
-
AV node delays impulse before ventricular conduction.
-
Bundle branches and Purkinje fibers distribute the signal throughout ventricles.
Recording Techniques: Leads and Electrodes
Electrodes detect electrical activity from different angles.
-
Standard 12-lead ECG provides multiple views of heart activity.
-
Limb and chest electrodes are placed in precise anatomical positions.
-
Proper electrode placement ensures accurate and reproducible tracings.
Reading and Interpreting Tracings
Interpreting ECGs involves analyzing waveforms, intervals, and segments.
-
Compare each wave’s amplitude and duration to normal ranges.
-
Identify rhythm, conduction, and possible abnormalities.
-
Document findings systematically in the lab notebook.
Documenting ECG in a Lab Notebook
Standard Lab Notebook Formats for ECG
Lab notebooks typically use tables and diagrams.
-
Columns for waves, intervals, and observations.
-
Space for measurement values and annotations.
-
Templates may follow standardized academic or clinical guidelines.
Organizing Waves, Intervals, and Segments
Structure documentation sequentially.
-
Record each P wave, QRS complex, and T wave.
-
Note intervals like PR, QT, and RR for each tracing.
-
Label abnormalities clearly for reference and discussion.
Including Measurements and Observations
Measurements should be precise and repeatable.
-
Use a ruler or digital software to determine durations.
-
Record heart rate calculated from RR intervals.
-
Include qualitative observations: waveform morphology and irregularities.
Roles and Responsibilities in ECG Recording
Student/Practitioner Responsibilities
Students or practitioners must record accurate tracings.
-
Follow standard electrode placement.
-
Maintain clean, functional equipment.
-
Document findings in a clear, consistent format.
Instructor or Supervisor Oversight
Supervisors ensure data quality and student adherence.
-
Verify correct technique and tracing quality.
-
Provide feedback on measurements and annotations.
-
Confirm safety protocols during ECG recording.
Ensuring Accurate Data Capture
Accuracy requires attention to detail.
-
Minimize artifacts from movement or electrical interference.
-
Calibrate machines regularly.
-
Review recordings before final documentation.
Importance of Proper ECG Documentation
Academic Significance in Physiology Labs
Correct documentation supports learning.
-
Helps students understand cardiac conduction in practice.
-
Facilitates grading and instructor evaluation.
-
Provides a reference for future experiments.
Clinical Relevance for Future Practice
Accurate records support clinical decision-making.
-
Enables comparison with patient ECGs.
-
Helps detect subtle changes over time.
-
Provides legal and professional documentation of findings.
Avoiding Misinterpretation and Errors
Clear documentation reduces mistakes.
-
Mislabeling or missing waves can lead to incorrect conclusions.
-
Systematic recording prevents data loss and miscommunication.
-
Observational notes clarify unusual patterns.
Benefits of a Well-Structured Lab Notebook
For Students: Improved Learning and Retention
A structured notebook enhances understanding.
-
Visual organization aids memory.
-
Stepwise measurements improve analytical skills.
-
Supports self-assessment and review.
For Educators: Easier Assessment and Feedback
Teachers can quickly evaluate progress.
-
Standardized tables simplify grading.
-
Annotations highlight strengths and errors.
-
Consistency allows comparison across students.
For Clinical Applications: Reliable Reference
Professional use benefits from detailed records.
-
Provides baseline data for patient monitoring.
-
Serves as a reference for research or case studies.
-
Facilitates collaboration with colleagues.
Best Practices for ECG Lab Notebooks
Standardized Notation and Labeling
Use consistent symbols and units.
-
Clearly mark wave peaks and intervals.
-
Include lead identification and tracing date.
-
Avoid ambiguous abbreviations.
Using Diagrams and Annotations Effectively
Visual aids complement written data.
-
Sketch representative ECGs with labeled components.
-
Highlight abnormalities with arrows or color codes.
-
Include notes on unusual findings or measurement tips.
Maintaining Consistency Across Experiments
Consistency ensures reliable comparisons.
-
Follow the same format for all recordings.
-
Use uniform scales for amplitude and timing.
-
Update templates as protocols evolve.
Common Mistakes and Risks
Mislabeling Waves and Intervals
Incorrect labeling can invalidate data.
-
Verify P, QRS, and T wave identification.
-
Double-check interval measurements.
-
Confirm electrode placement for accurate signals.
Incorrect Measurements or Calculations
Errors in timing or amplitude distort interpretation.
-
Use calibrated tools or software for precision.
-
Repeat measurements for verification.
-
Note any anomalies or artifacts observed.
Poor Recording Techniques
Artifacts can affect ECG quality.
-
Ensure electrodes have good skin contact.
-
Avoid movement during recording.
-
Monitor equipment performance before and during use.
Tools and Techniques for Accurate ECG Documentation
ECG Machines and Software Interfaces
Modern ECG machines provide reliable recordings.
-
Digital machines often include automatic measurements.
-
Software can annotate waves and generate reports.
-
Ensure familiarity with the interface to avoid errors.
Digital vs. Manual Recording Methods
Both methods are valid depending on context.
-
Manual: precise, low-tech, good for learning measurement skills.
-
Digital: faster, allows automated analysis and storage.
-
Hybrid approaches combine both for verification.
Annotation and Diagramming Tools
Tools support clear documentation.
-
Use colored pens or digital markers for labeling.
-
Include grids for accurate amplitude and time representation.
-
Maintain organized diagrams for each lead.
Actionable Checklists for Students
Pre-Recording Checklist
-
Verify electrode placement and skin prep.
-
Calibrate ECG machine and check leads.
-
Prepare lab notebook and templates.
During Recording Checklist
-
Monitor signal quality continuously.
-
Label each waveform as it occurs.
-
Measure intervals and note observations.
Post-Recording Verification Checklist
-
Review tracings for clarity and completeness.
-
Double-check measurements and labels.
-
Save or scan digital recordings for reference.
Comparing Lab Notebook Approaches
Digital vs. Paper Lab Notebooks
-
Digital allows easy storage, search, and sharing.
-
Paper supports tactile learning and immediate annotation.
-
Both can complement each other for verification and backup.
Standardized Templates vs. Freeform Notes
-
Templates ensure consistency and completeness.
-
Freeform notes allow flexibility for unusual cases.
-
Combining both approaches often works best.
Pros and Cons of Each Method
-
Digital: efficient but dependent on power/software.
-
Paper: reliable, portable, but harder to organize long-term.
-
Choice depends on lab environment and learning goals.
Additional Resources for ECG Study
Recommended Textbooks and Guides
-
“Rapid Interpretation of ECGs” by Dale Dubin
-
“ECG Made Simple” by John R. Hampton
-
Standard physiology lab manuals
Online ECG Simulators and Tools
-
Web-based ECG simulation software
-
Virtual labs for student practice
-
Measurement tools for interval calculation
Peer-Reviewed Articles and Lab Manuals
-
Journal of Electrocardiology
-
American Heart Association educational resources
-
University lab manuals for physiology courses
FAQs
How do I measure the PR, QRS, and QT intervals accurately?
Accurate measurement requires identifying the start and end points of each wave on the ECG tracing. Use calipers or digital tools to mark the beginning and end of the P wave, QRS complex, and T wave. Repeat measurements to ensure consistency.
What is the normal duration for each ECG component?
-
P wave: 0.08–0.11 seconds
-
PR interval: 0.12–0.20 seconds
-
QRS complex: 0.06–0.12 seconds
-
QT interval: 0.36–0.44 seconds
Comparing these durations to your recordings helps identify potential abnormalities.
How should I organize my ecg components lab notebook?
Use a consistent layout with sections for waves, intervals, segments, and observations. Include labeled diagrams, measurement tables, and notes on any irregularities. Standardized templates can improve clarity and make reviewing data easier.
Can lab notebooks be used for clinical reference?
Yes. When properly recorded and annotated, lab notebooks provide reliable baseline data and support analysis. Ensure measurements, dates, and lead placements are clearly documented.
What are common errors when documenting ECGs in a lab notebook?
Typical mistakes include mislabeling waves, inaccurate measurements, poor electrode placement, and incomplete observations. Systematic recording and double-checking data reduce these errors.